
Collecting data on the Powerball lottery depends on one’s perspective. Of course, for anyone who purchased a ticket, the first set of data points would be the winning numbers – checking to see if the numbers on the ticket match the winning numbers. If there is a partial match or complete match, the next important thing to know would be the amounts of winning. For those of us who have no skin in the (Powerball) game, looking at data would be for the purpose of trying to answer broader questions about Powerball or lottery in general. This post looks at Powerball jackpot payout data to answer questions.
For example, how often does someone win the Powerball jackpot? Every drawing (occurring twice a week) produces winners for the smaller prizes, but does not always produce winner(s) of the jackpot prize (the grand prize). If jackpot winners emerge, what would be the typical size of the “won jackpot”? After we take a look at the data, a clear pattern emerges. We will comment on the pattern that we see.
Powerball data are readily available. Historical Powerball winning numbers are published going far back. But the just knowing the winning numbers tell us nothing. The winning numbers alone do not tell us whether jackpot winners were produced in that drawing. The organization that runs Powerball make data for the smaller prizes readily available. However, the huge jackpot prizes are what captivate the public. It is natural that people would want to know how often the jackpot prizes are won, and how big the payouts are typically. However such data are not readily available.
Luckily a website keeps track of all the Powerball jackpot payouts from 2003 to August 26, 2017 (here’s the link and here’s the PDF file). The web page in the link lists out the draw date, the amount of the won jackpot, the names of winners and their state. The PDF file only has the draw date and the winning amounts.
There are 175 won Powerball jackpots in this 14-year period from 2003 to August 2017, giving an average of 12.5 won jackpots per year. Of course, that is not the end of the story. It is also helpful to look at data from two perspectives – looking at the data graphically and using numerical measures.
First let’s group the winnings by year.
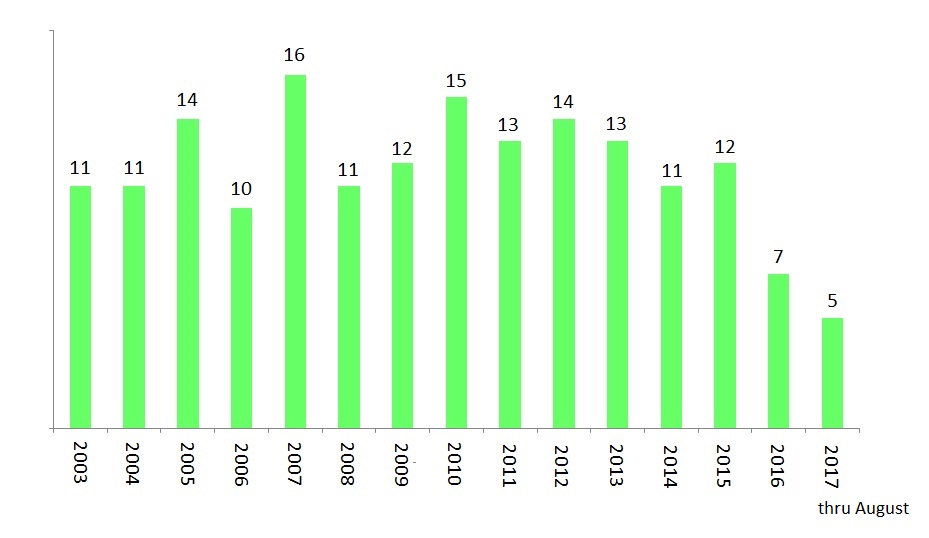
Figure 1 – Frequency of Powerball Jackpot Winnings
There are 11 Powerball jackpot winnings in 2003 and also 11 in 2004. The frequency fluctuates quite a bit. The counts range from 11 to 16 during the period from 2003 to 2015. There are only 7 Powerball jackpot winnings in 2016 and 5 in 2017. The year 2017 is a partial year. So let’s focus on 2016. Why are there fewer grand prize winners in 2006? Let’s look at the total payouts in each year.

Figure 2 – Powerball Jackpot Total Payout By Year (not including non-jackpot prizes)
For example, the 11 won jackpots in 2003 add up to $1,139 million ($1.139 billion). The total payouts in 2004 are slightly less but still in the $1 billion range. The annual total payouts increase steadily over the years but more dramatically in recent years. Notice the big spike in 2016. The Powerball jackpot payouts in 2014 and 2015 are around $1.8 billion. The payouts in 2016 are $3,431 million or $3.4 billion, essentially doubled from 2015.
The amount of jackpot winnings is an indication of ticket sales. So 2016 was a banner year for Powerball (for the people running Powerball). Sales were up, revenue were up. The next graph shows the average payout per jackpot by year.
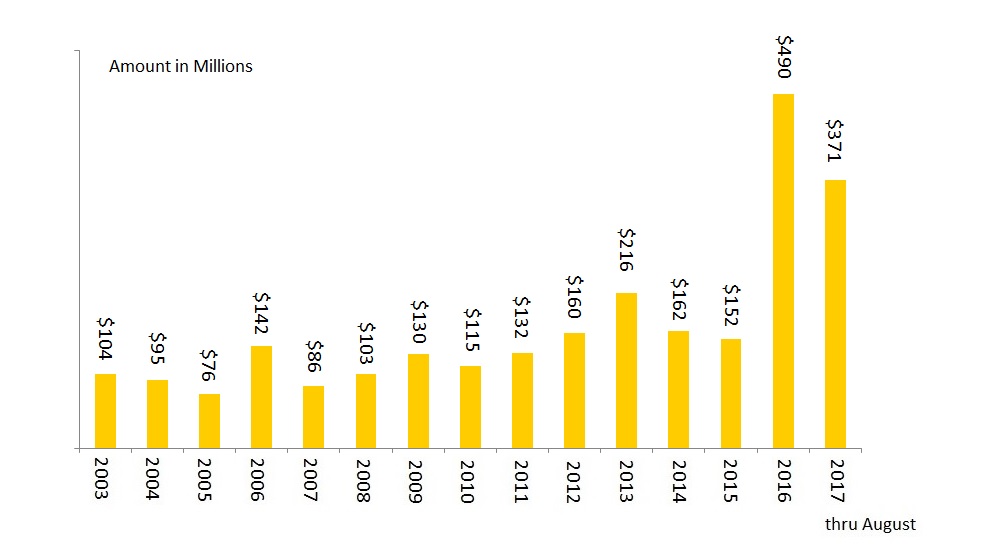
Figure 3 – Powerball Jackpot Average Payout By Year (not including non-jackpot prizes)
The average payout is calculated by summing all the payouts in a given year and divided by the number of payouts in that year. Once again 2016 has a huge spike. Prior to 2016, the average jackpot payout is in the $100 million range. In 2016, the average Powerball payout per jackpot is $490 million (just $10 million shy of half a billion dollars). For the 12 winnings in 2016 and 2017, the average jackpot winning is about $440 million while the average jackpot winning prior to 2016 is about $128 million. The average in 2016 and 2017 is 3.4 times higher the average in the prior years.
The largest jackpot winning in Powerball’s history occurred in January 2016 and it is a whopping $1.58 billion! That one jackpot alone would be greater than the total payouts for some of the prior years!
It is clear from the graphics and the calculation that there are now fewer Powerball jackpot winners. So it is getting harder to win the Powerball jackpots. The winning jackpot sizes are dramatically getting bigger. This phenomenon has been occurring since the end of 2015. This is no coincidence though. The bigger payouts and the more difficult odds are in fact manufactured.
In October 2015, a new set of Powerball rules went into effect that make it much harder to win the jackpot but easier to win the smaller prizes. As a result, the jackpot keeps building until it reaches the hundreds of million dollars range (or even the billion dollar range). The folks that redesign the rules understood that excitement drives ticket sales. In a sense the public is manipulated and the frenzy around the huge jackpot is manufactured. When the jackpot reaches half a billion dollars, some people who normally would not play Powerball would buy one ticket (or multiple tickets) just to join the excitement.
The most recent Powerball jackpot win is on August 23, 2017. The total jackpot is $758.7 million. The excitement would begin to build as the jackpot rises to several hundred million dollars. As the excitement grew in the course of several months (the jackpot winning prior to August 23 is on June 10, 2017), the increased volume of ticket sales would make it more and more likely that a jackpot winner would emerge.
There are over 292 million different 6-number Powerball combinations. For a winner to emerge, there must be enough people who purchase a large portion of these 292 million combinations. For that to happen, there must be sufficient excitement to drive ticket sales. To understand this dynamics, it is helpful to understand why the odds of winning the Powerball jackpot are 1 in 292 million (see here for the calculation).
It seems that Powerball is a great business model for the people who run it. Is it a great business model for the Powerball players? Should they invest their money elsewhere? This point is discussed in a piece in a companion blog. Another piece discusses Poweball and the lottery curse.


Pingback: How often are Powerball jackpots won? – Talking About Numbers